Science · Research
Immune gene variants act in specific cell types
A Nature paper published on 28 October 2026 reports that pattern in 5,438,679 immune cells from 1,925 adults.
In this story
- The same genetic variant can be associated with gene activity in one immune cell type or state, while showing no detectable effect in another.
- Researchers measured more than 5.4 million immune cells from 1,925 people and found regulatory signals that a whole-blood average often misses.
- The findings connect specific immune cell types with genetic signals associated with inflammatory, autoimmune, and other diseases.
- The study is a detailed map of candidates, and it does not establish a diagnostic test or a treatment.
The same genetic variant can be associated with gene activity in one immune cell type or state, while showing no detectable effect in another.
A Nature paper published on 28 October 2026 reports that pattern in 5,438,679 immune cells from 1,925 adults.
Nearly every cell in a person's body carries essentially the same DNA, yet cells do not use every gene at once, and the RNA they make is a measure of that activity rather than a direct count of the protein the gene can produce. A statistical association means the variant and the RNA level move together in this sample, which does not establish that the variant causes a disease, and a cell type with no detectable signal may simply have had too few cells for the test to see an effect. That is how one genome can line up with different RNA levels once the cells are examined separately instead of being averaged into one blood measurement.
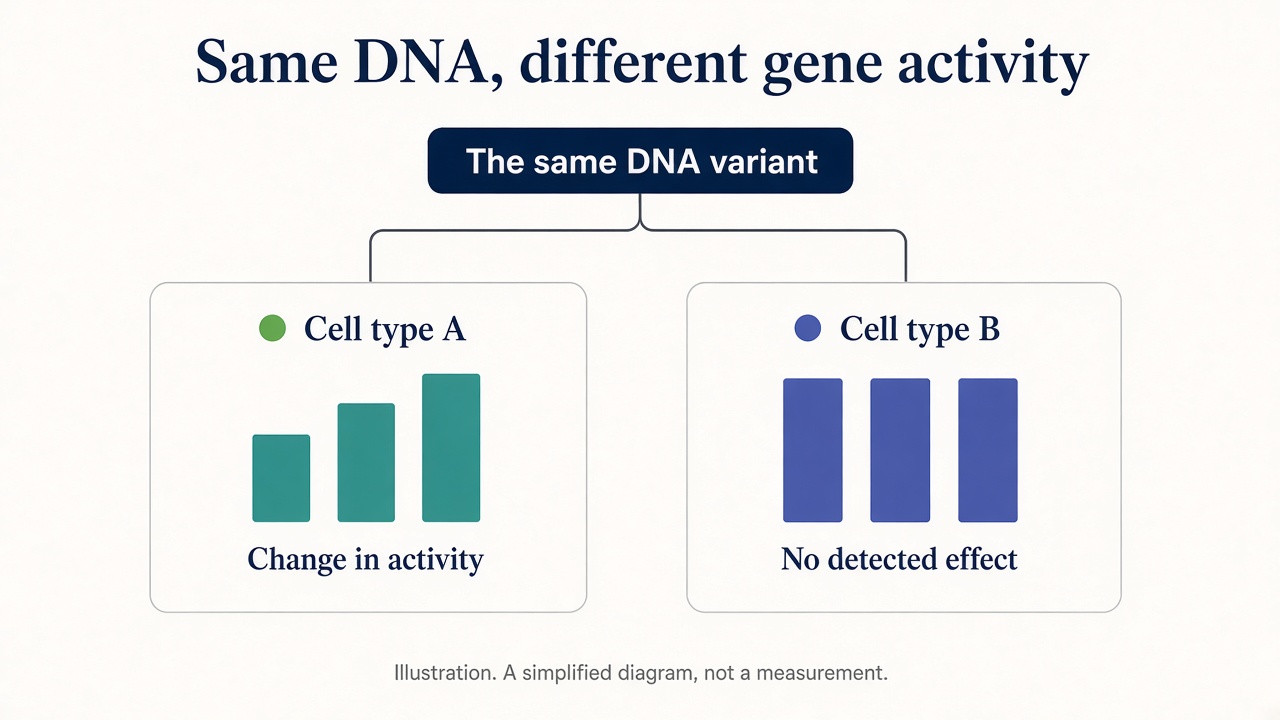
Researchers measured more than 5.4 million immune cells from 1,925 people and found regulatory signals that a whole-blood average often misses.
Anna Cuomo and colleagues report phase 1 of TenK10K, the flagship paper of that phase, a project built to cover up to 10,000 cells from each of 10,000 people, in the 28 October 2026 issue of Nature, and the paper's DOI is 10.1038/s41586-026-10721-2. This phase used peripheral blood mononuclear cells assigned to 28 immune cell types, with an average of 2,825 cells per person after quality control, plus a full genome sequence for each person. The analyzed group is of European ancestry, 950 people from the Tasmanian Ophthalmic Biobank and 975 from BioHEART, and the Tasmanian bank recruited adults who reported British, Scottish, or Irish ancestry and had no sign of eye disease, while BioHEART recruited adults who came for heart imaging or with a heart attack. Those counts are in the Nature paper.
The genomes contained 66,658,242 variant sites, and 53,784,018 of them, or 80.6 percent, were rare, a minor-allele frequency under 1 percent in this group, which counts positions where a variant was seen rather than the number of variants carried by any one person. For common variants, those above a 1 percent frequency, the team tested sites within 100 kilobases of each gene with a method called SAIGE-QTL, which keeps each cell's RNA count instead of collapsing a person's cells into one average, and they ran that test separately in each cell type. At a false-discovery rate under 5 percent they reported 154,932 common-variant expression signals spread across the cell types, covering 17,674 of 21,404 genes tested, or 83 percent, and that 2026 figure is an association in this sample rather than a forecast.
Compared with OneK1K, which the paper calls the previous largest single-cell map of blood, Cuomo and colleagues report nearly three times as many genes with a common-variant signal, 17,674 against 6,469, and that comparison is a 2026 count of associations rather than a forecast. The paper attributes that gain to about twice as many people, 1,925 against 982, more cells per person, 2,825 against 1,291, finer groups, 28 cell types against 14, and a test that models each cell instead of one average per person. When they averaged all 28 cell types into one value per person, the same data yielded 11,359 genes at the same false-discovery rate, which the paper describes as nearly 30 percent fewer than the cell-by-cell list and similar to the count in the most abundant cell type. The TenK10K count is also close to the 16,987 genes eQTLGen found in whole blood from more than 30,000 people, yet 4,572 of the TenK10K genes were absent from that average and were more often limited to particular cell types in the comparison the paper reports.
Rare variants were tested in groups, because one rare change is usually too scarce for a single-site test, and a burden test together with a SKAT test found 34,376 signals and 10,005 genes, 47 percent of the genes tested in this 2026 analysis. The paper reports lower SH2D2A RNA in CD4 central-memory T cells linked to rare variants, and a TMED3 variant that SpliceAI and AlphaGenome predict will remove a normal splice site, matching the lower TMED3 RNA they measured in those cells rather than a result the paper shows in every cell type. Of the 17,674 genes with a common-variant signal, 8,506 were significant in at most seven of the 28 cell types, and only 35 genes had a significant signal in every cell type, with the authors noting that a missing signal can reflect too few cells of that type. They also note a limitation of the specificity score, because no independent data set of this size was available to check whether the strongest calls were inflated.
The findings connect specific immune cell types with genetic signals associated with inflammatory, autoimmune, and other diseases.
The expression map was set beside genome-wide association results for 16 diseases and 44 blood traits, and a colocalization was counted when the model put the probability of a shared variant at 0.8 or higher, giving 60,458 combinations of gene, cell type, and trait, covering 5,287 genes, of which disease traits accounted for 5,491 events and 1,469 genes, and colocalization names a candidate for a later experiment rather than proof that the gene causes the disease. Oncostatin M, the protein made from OSM, is one candidate, and the authors report higher OSM RNA in natural killer cells among people who carry an inflammatory bowel disease risk allele, with a shared-variant probability of 0.99 in those cells, even though OSM RNA is present in 20 of the 28 cell types and has expression signals in 11. That 0.99 figure is the model's score that the two signals share a variant, not a 99 percent chance that a person will develop the disease. Higher IGHG4 RNA in memory B cells matched a higher genetic risk of Alzheimer's disease, again at 0.99 in that same analysis, and IGHG4 encodes part of an IgG4 antibody, but the paper does not establish that IgG4 antibodies cause Alzheimer's disease. Across the 16 diseases, the largest share of those events falls to dendritic cells for Alzheimer's disease, to B cells for systemic lupus erythematosus, and to CD4 T cells for rheumatoid arthritis, according to the paper's own cell-type breakdown, which does not make one population the sole cause of the illness.
In natural killer cells, a method called scDeepID marked cell states, and the authors reported more than 15,000 state-dependent expression signals, including an S100B signal that varied with NF-kB signaling, while another 164 signals were linked to the share of cells in a state, most often among monocytes, dendritic cells, and natural killer cells. A missense change in LYZ, the lysozyme gene, tracked a monocyte shift in the published 2026 cell-state analysis, whose correlated genes were enriched for an inflammatory-response set, and the paper does not establish that the variant starts inflammation or that the shift is itself a disease. The authors treat a finer cell-type map as a way for later studies to connect a disease variant to a gene and a cell, which is a research direction in the TenK10K discussion rather than a therapy already in hand or a guide for treating an individual patient.
Individual-level genomes and the cell-level RNA counts are in the European Genome-phenome Archive under controlled access, accessions EGAS50000001653 and EGAS50000001654, as the Nature data note states, while the summary statistics the paper cites are deposited at Zenodo under DOI 10.5281/zenodo.18221260, and those individual files are not posted with the article. The Zenodo record opened on 29 October 2026 is version 2, dated 30 January 2026, and its own description still names the preprint rather than a file set released on the October Nature publication date, so the page is the cited statistics and not a later deposit. Accompanying papers from this same phase, which the flagship paper describes as separate analyses of the same effort, examine tandem-repeat variation, links between these expression measures and disease, and chromatin accessibility in immune cells, and the flagship paper does not treat those companion analyses as a second independent cohort. This single study measured circulating blood mononuclear cells from people of European ancestry, and the authors say other ancestries and other tissues are still required before the same associations can be treated as a general map of human immunity.
The study is a detailed map of candidates, and it does not establish a diagnostic test or a treatment.